
Wireframing for Dashboard
I built a basic wireframe keeping in mind the data, the arrangements and the elements
The problem statement given to me was as follows
Page : Analytics Dashboard
Target Audience : Enterprise IT Ops, Marketing
Target Devices : Desktops (Touch friendly desktops as well).
Description :
This dashboard will provide information on the health of key metrics & / or reports. One should be able to navigate back from the dashboard to a main screen.
Information Model (for elements to be shown in Dashboard) :
Index
Name (of Report/Metric)
Overall Health of Metric.
Configuration Options e.g. Interval for which detailed metric/report can be generated
Actions : e.g View Details, Subscribe to alerts, Trigger jobs.
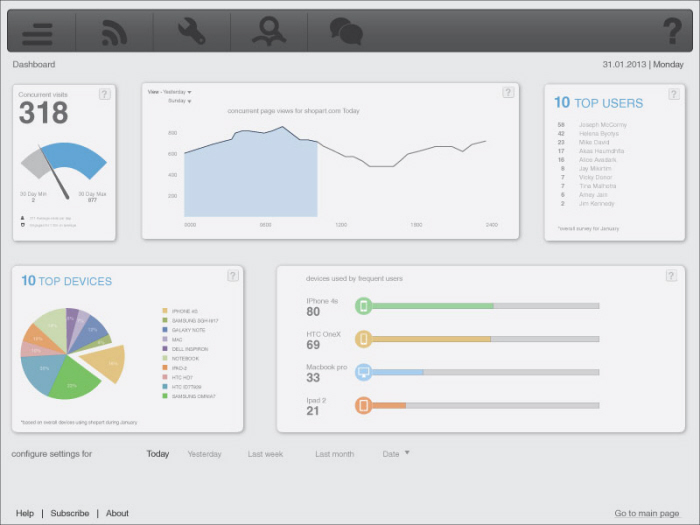
The first draft of the dashboard
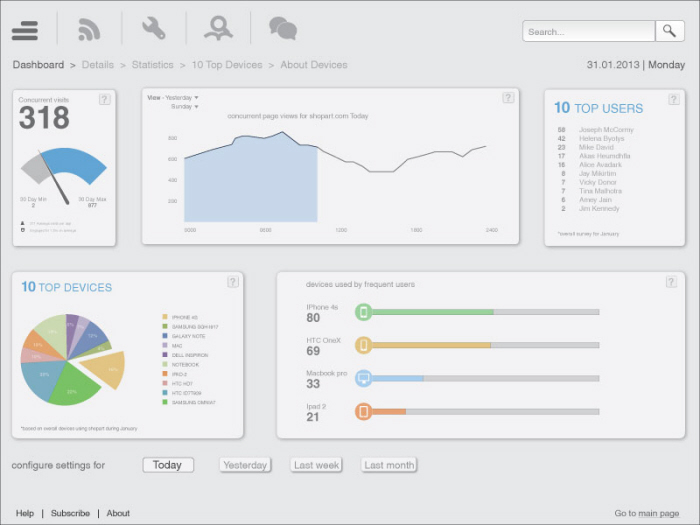
The final and approved iteration
The problem statement given to me was as follows
Page : Analytics Dashboard
Target Audience : Enterprise IT Ops, Marketing
Target Devices : Desktops (Touch friendly desktops as well).
Description :
This dashboard will provide information on the health of key metrics & / or reports. One should be able to navigate back from the dashboard to a main screen.
Information Model (for elements to be shown in Dashboard) :
Index
Name (of Report/Metric)
Overall Health of Metric.
Configuration Options e.g. Interval for which detailed metric/report can be generated
Actions : e.g View Details, Subscribe to alerts, Trigger jobs.
I used a clean design and gave plenty of breathing space to the dashboard. I also tried to match the company profile and their requirements in the design.
gLike
Interface for Dashboard - Native5
Designed the interface of a dashboard for the firm Native5. I worked as per the specifications of a problem statement given to me.
Time of Completion : 3 hours