
When I was hired by Barefoot Book to design their compensation guide, my first goal was to revision their compensation diagrams. Applying my research on social network visualizations, I convinced them to move away from their former pyramid-shaped diagrams. I designed these network diagrams so that they would build, one-on-top-of-the-other from 0 (stars) through 6, reinforcing Barefoot Book's key message of a self-centric growth model.
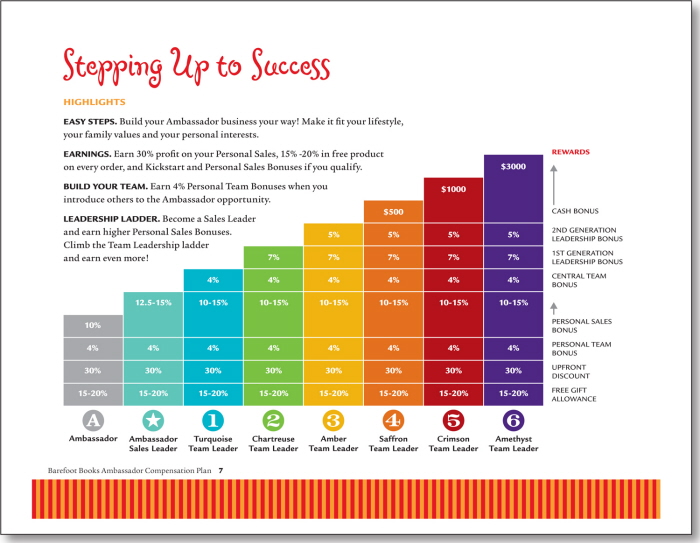
A page from Barefoot Book's compensation guide. It illustrates how individuals in the Ambassador sales force team can "Step Up to Success" through increased sales and recruitment.
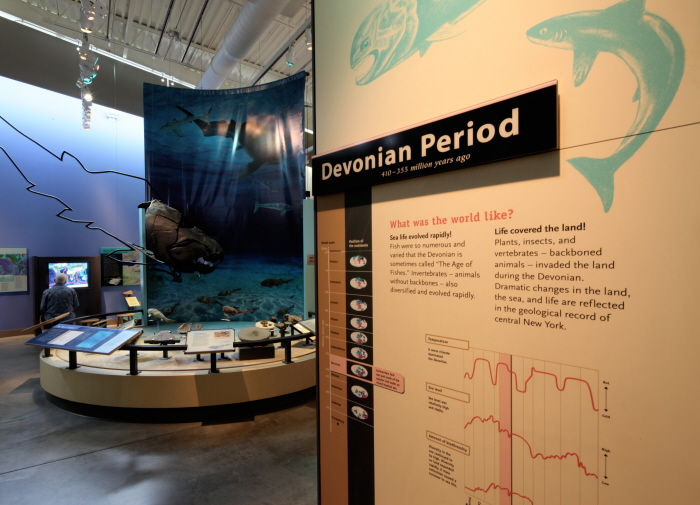
Each featured time period in the Museum of the Earth's "A Journey Through Time: 4.5 Billion Years on this Unique Planet," is introduced with a "graphic monolith." To introduce key messages for each of the time periods, information graphics highlight the position of the earth's continents, as compared to other periods in the Earth's history, as well as changes in temperature, sea level, and measurable levels of biodiversity.
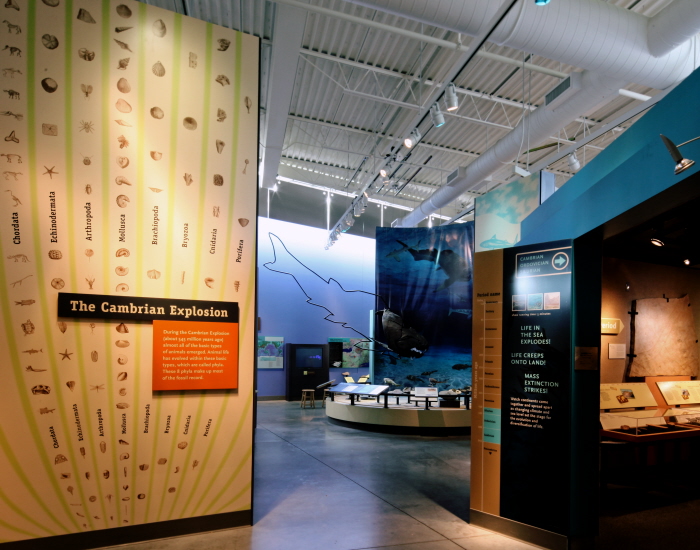
This 11-foot high entry mural, on the left, tells the story of the evolutionary explosion of life forms that took place during the Cambrian Period. The visual language of this graphic is tied to the 50+ "tree of life" illustrations that visitors encounter as they make their way through the Museum of the Earth's "A Journey Through Time" exhibition. This permanent exhibition gallery is located in Ithaca, New York.
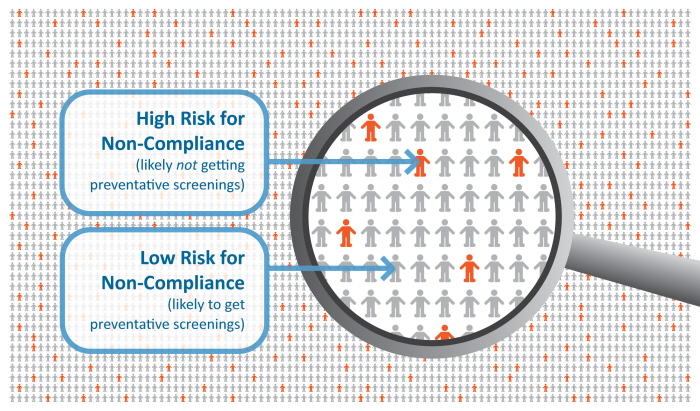
A visual I designed for Decision Point Healthcare Solutions for the purpose of explaining how member groups can be analyzed to predict member engagement behavior.

A still frame of an animation sequence I created for Decision Point Healthcare Solutions to explain how predicting member engagement behavior allows them to understand members' barriers to engagement. Understanding these barriers then allows them the ability to deliver the right messages through the right channels to the members that need them the most.
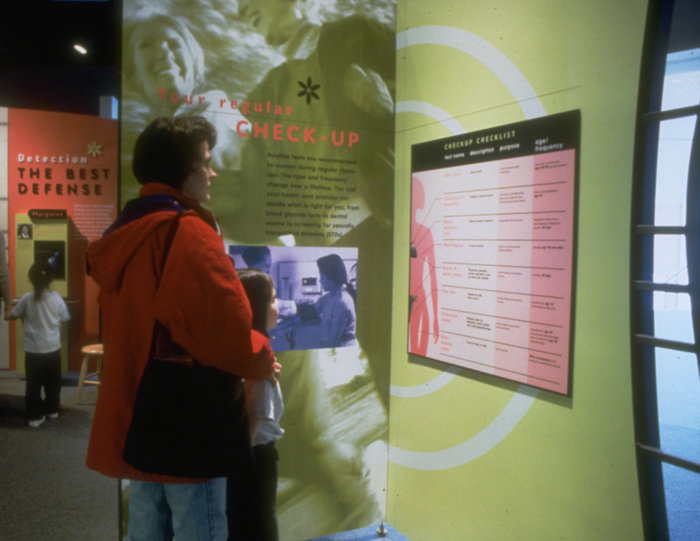
This Checkup Checklist for women is one of many information graphics I worked on for "The Changing Face of Women's Health," a traveling exhibition that opened at the Maryland Science Center and traveled nationally.
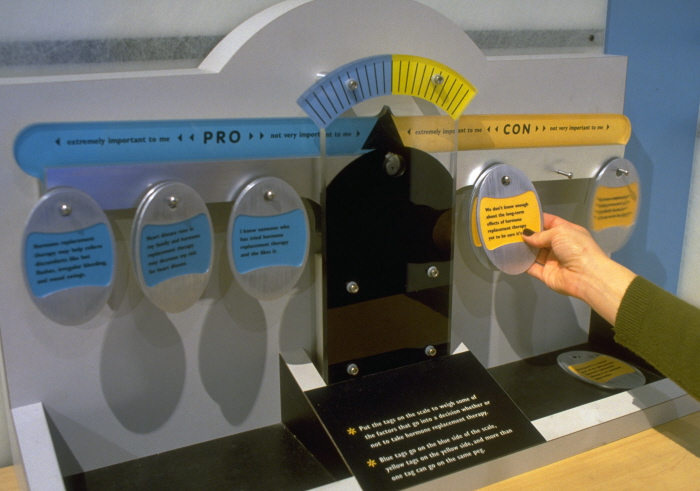
A custom scale designed for the Maryland Science Center's "Changing Face of Women's Health" traveling exhibition. Visitors are invited to weigh the pros and cons of taking hormone replacement therapy. This interactive information graphic provides strong visual feedback indicating which way a person's decision is leaning.
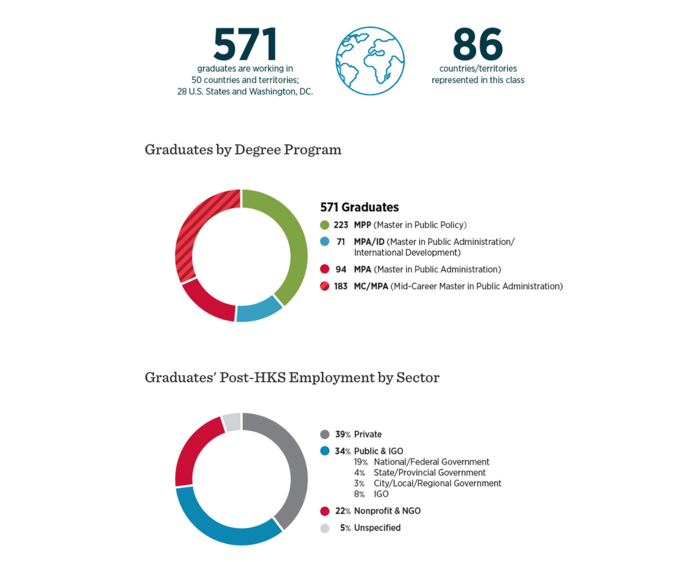
Data visualizations for Harvard Kennedy School's Office of Career Advancement. I worked HKS's marketing director to move their yearly Employment Snapshot content online: see https://www.hks.harvard.edu/more/employers/about-our-graduates/employment-snapshot/class-2020-employment-snapshot
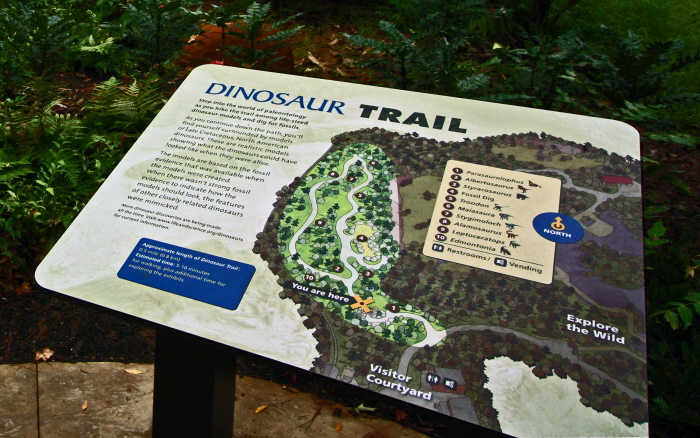
The wayfinding map for "Dinosaur Trail" is another example of the system of maps developed for the Museum of Life and Science's outdoor parks. The entire park is shown on each map, and the outdoor exhibition area you're entering is highlighted.
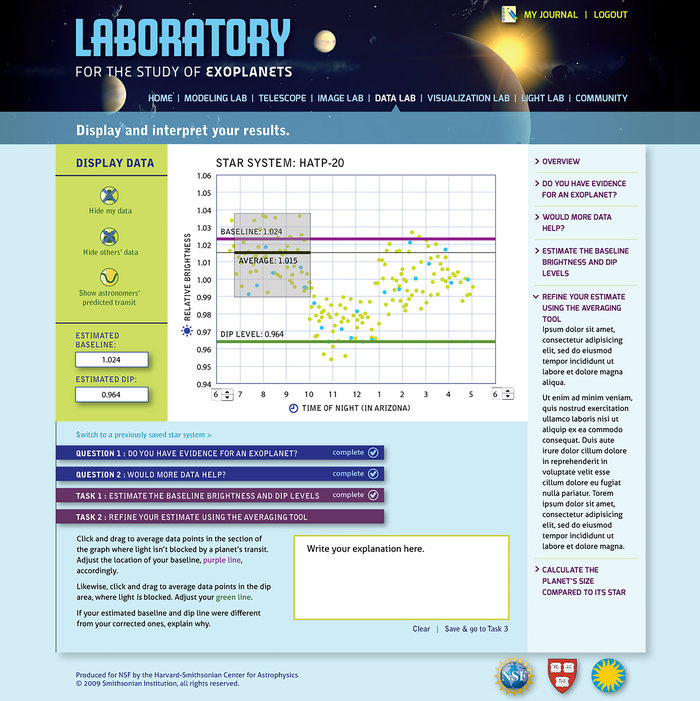
Data visualization from a sequence of guided explorations I designed for the Laboratory for the Study of Exoplanets – an online educational program for high school physics students. It was developed by the Smithsonian Astrophysical Observatory.
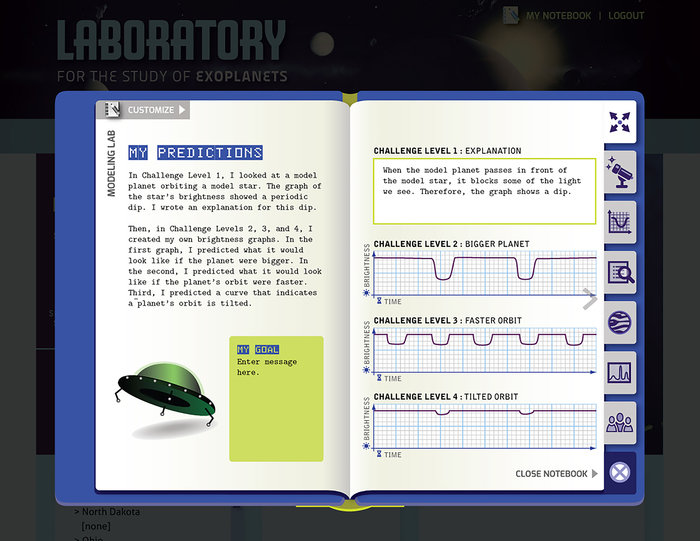
One of several concepts I developed to illustrate how students of the Laboratory for the Study of Exoplanets can store their data in personalized virtual notebooks.
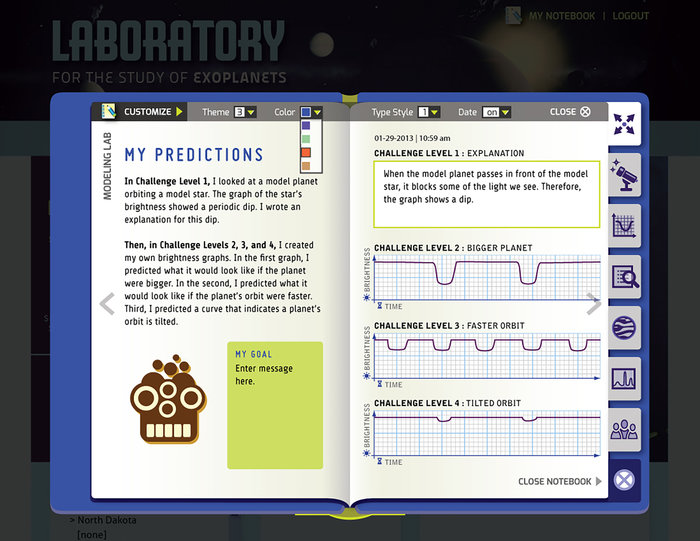
Students have pre-set themes that give them the ability to select their color palette, font, and family of design elements for making their data notebook uniquely theirs.
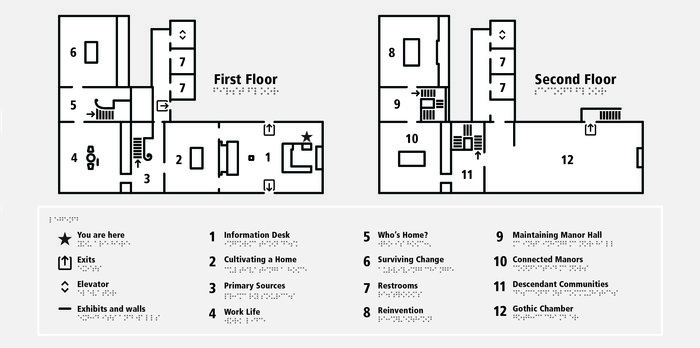
Tactile map for blind visitors to Philipse Manor Hall — a project by Amaze Design. I researched and designed this map accordance with best practices for accessibility.
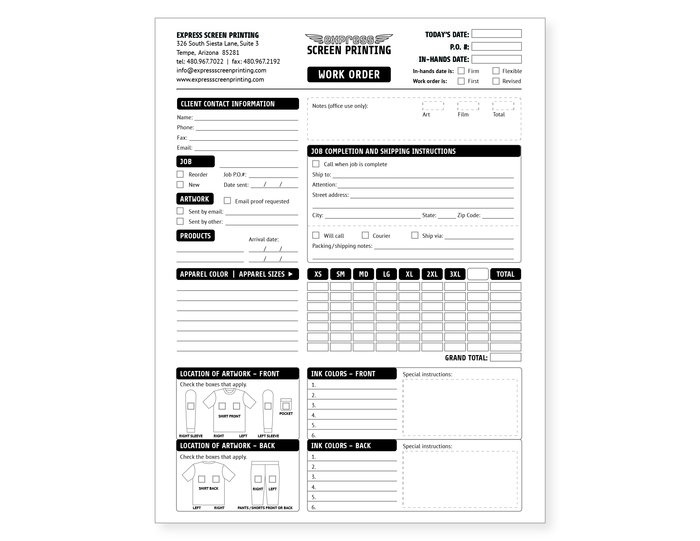
Express Screenprinting's business is driven by this form — the single, most important tool for receiving and tracking orders as well as ensuring quality, accuracy, and timeliness. The redesign of their identity, website, and signage necessitated revisioning this important form.
gLike
data visualization | information design