
A diagram accompanying a whitepaper describing the permitting process for photovoltaic manufacturing companies, published in PV Tech Magazine in March 2012.
View PDF
View PDF
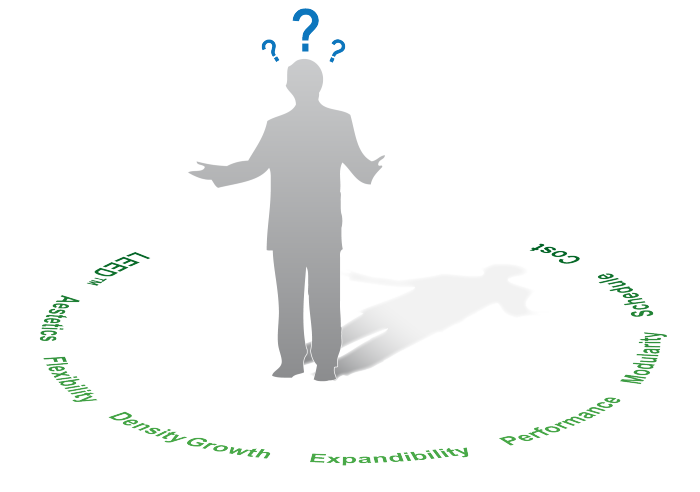
Infographic capturing the many decision points manufacturers face when building a new facility.

Infographic for a presentation: hindsight is 20/20.
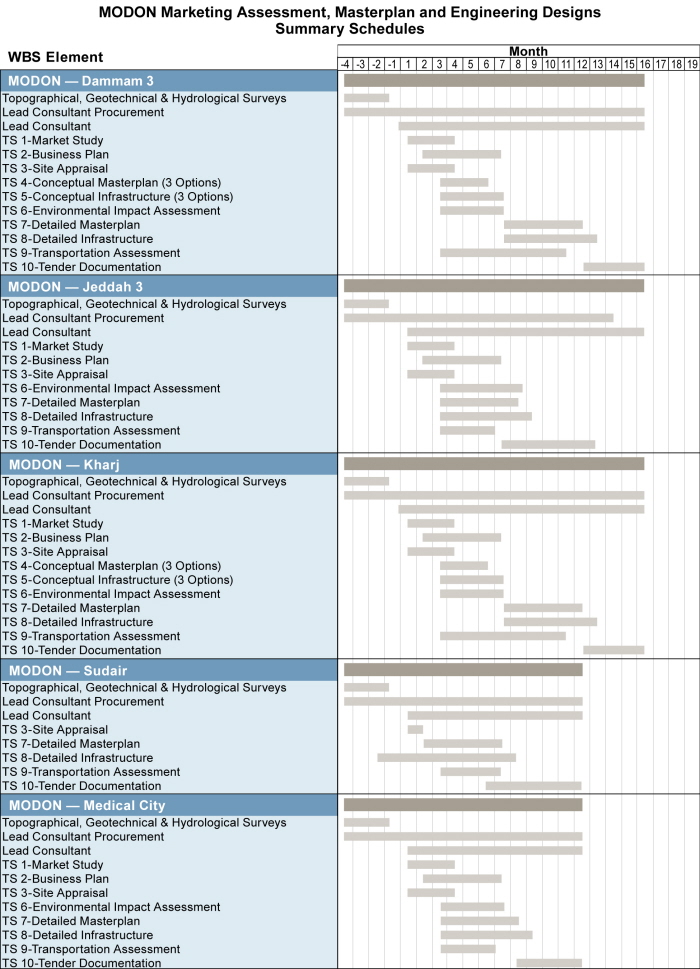
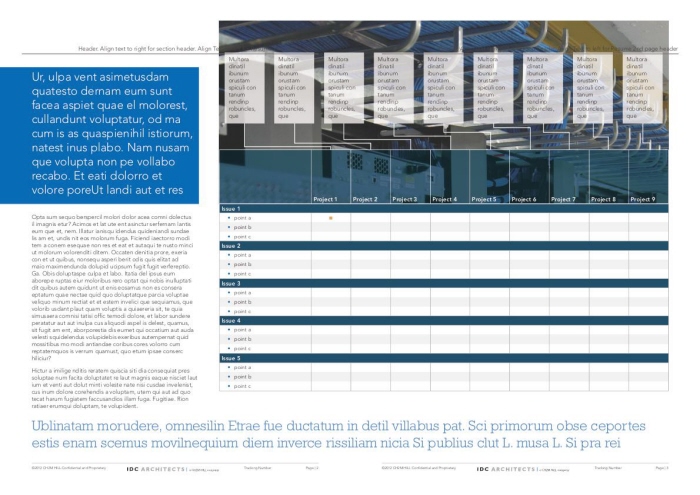
Infographic: a schedule consolidated from five different documents into a one-page format.
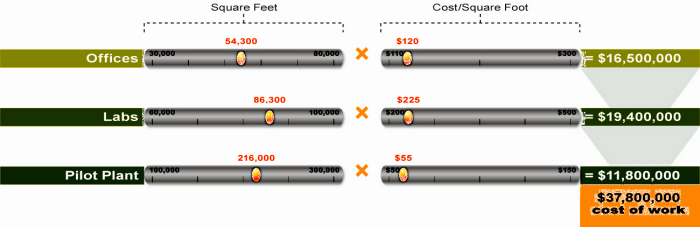
Infographic for a proposal, showing a comparison of costs per square foot for different building areas.
A flowchart, just for fun.
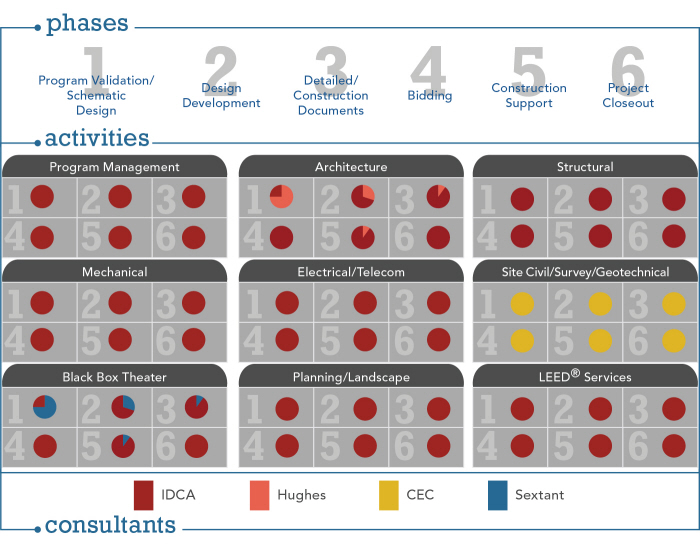
Infographic for a proposal, showing three dimensions of information: for each project phase, which consultant in the team will be involved, and what percentage of work will be performed by each consultant for each phase.
An infographic mock-up spread for a proposal, showing placement of a variety of GIFBP messaging.
View PDF
View PDF
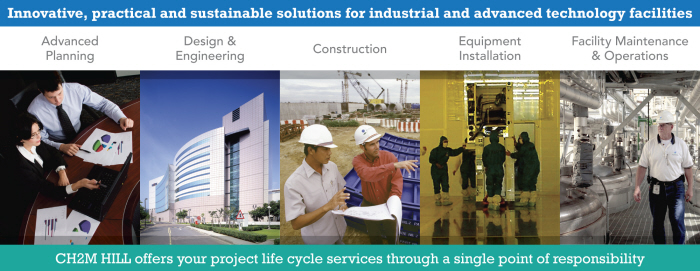
A powerpoint graphic describing the company's life-cycle services
A simple process graphic for a presentation.

A logo I did for a consulting project my company is performing. The parameters were to include a diamond, a North Star, sustainability, and the countries where the project is being executed. This was for use in project documents (Microsoft Word, Excel, Project, PowerPoint, etc.) and needed to print clearly in both grayscale and in color.

An infographic poster made for a client's internal energy efficiency campaign. The poster can be used as a whole or broken apart for use in email blasts, memos, etc.
View PDF
View PDF

An infographic for a PowerPoint presentation, showing the relative amount of water to treat in two different watersheds.

A diagram explaining the sales organization's roles and responsibilities. Made in Illustrator; performed concept development, graphic design.

A fun graphic in a series that was interspersed throughout a proposal showing tasks to be completed on any given day. Inspired by the page-a-day calendars. This was done in PowerPoint.

A basic comparison diagram showing the time savings between two construction approaches. Made in InDesign.

One of a suite of proposal document infographics to illustrate high-level scheduling, company experience, and project execution flow. These were done in PowerPoint to make them accessible to team members not fluent in the Adobe Creative Suite and allow editing on the fly to meet our tight turn-around times for submittals. 1/7

One of a suite of proposal document infographics to illustrate high-level scheduling, company experience, and project execution flow. These were done in PowerPoint to make them accessible to team members not fluent in the Adobe Creative Suite and allow editing on the fly to meet our tight turn-around times for submittals. 2/7

One of a suite of proposal document infographics to illustrate high-level scheduling, company experience, and project execution flow. These were done in PowerPoint to make them accessible to team members not fluent in the Adobe Creative Suite and allow editing on the fly to meet our tight turn-around times for submittals. 3/7

One of a suite of proposal document infographics to illustrate high-level scheduling, company experience, and project execution flow. These were done in PowerPoint to make them accessible to team members not fluent in the Adobe Creative Suite and allow editing on the fly to meet our tight turn-around times for submittals. 4/7

One of a suite of proposal document infographics to illustrate high-level scheduling, company experience, and project execution flow. These were done in PowerPoint to make them accessible to team members not fluent in the Adobe Creative Suite and allow editing on the fly to meet our tight turn-around times for submittals. This graphic condensed three pages of disparate information on scheduling, location, and tasks into a concise presentation taking less than a page so a paragraph of explanatory text could precede it. 5/7

One of a suite of proposal document infographics to illustrate high-level scheduling, company experience, and project execution flow. These were done in PowerPoint to make them accessible to team members not fluent in the Adobe Creative Suite and allow editing on the fly to meet our tight turn-around times for submittals. This graphic condensed four pages of content in the proposal into less than a page. The rainbow of colors used in the project imagery was less than perfect, but it was the best I could do under the project time constraints (about an hour spent on this graphic). 6/7

One of a suite of proposal document infographics to illustrate high-level scheduling, company experience, and project execution flow. These were done in PowerPoint to make them accessible to team members not fluent in the Adobe Creative Suite and allow editing on the fly to meet our tight turn-around times for submittals. 7/7
gLike
Infographics and illustrations
Information graphics and illustrations made for business development proposals and presentations.