Midtown Map

Glaucoma diagram

Subsidizing commuters - tax breaks available to those who use alternative transit methods.

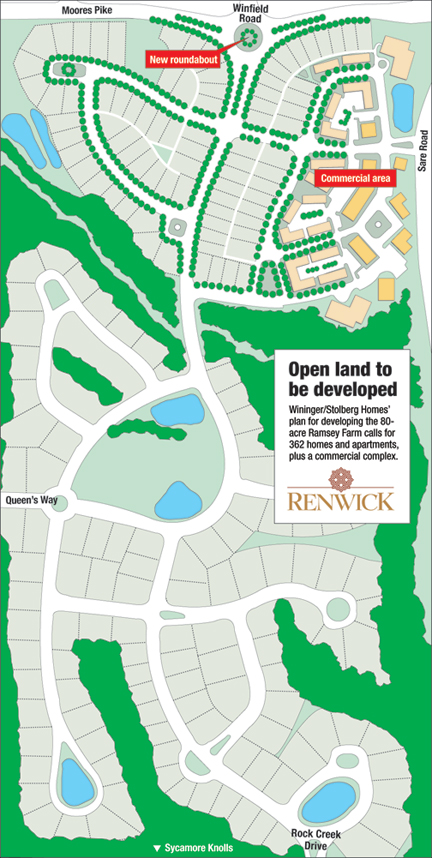
Renwick map

Three entrepreneurs who founded firms at the depths of the recession.

Big Ten preview table

Hard Left - illustrating the inherent difficulties of a 'Michigan-left' intersection.

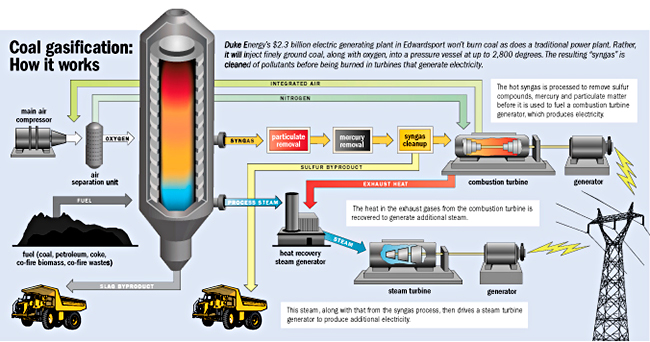
Coal Gasification diagram

I-69 extension map

Academic Improvement in Indianapolis area

How to cut corners and costs on road construction

Underground walkway to Lucas Oil Stadium

IUPUI School of Optometry - Each side of the new school mimics the architectural style of the existing building it faces.

How Smart Meters work

Mutual funds stage comeback - Performance of Indiana-based mutual funds.

Fiber-optic map/diagram

Cell-phone History
gLike