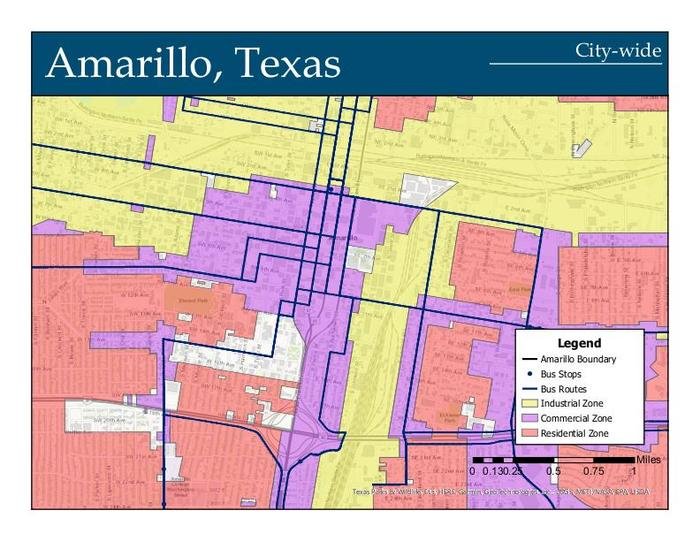
City center map showing zoning, light rail and bus routes and stops, and the city boundary.
View PDF
View PDF
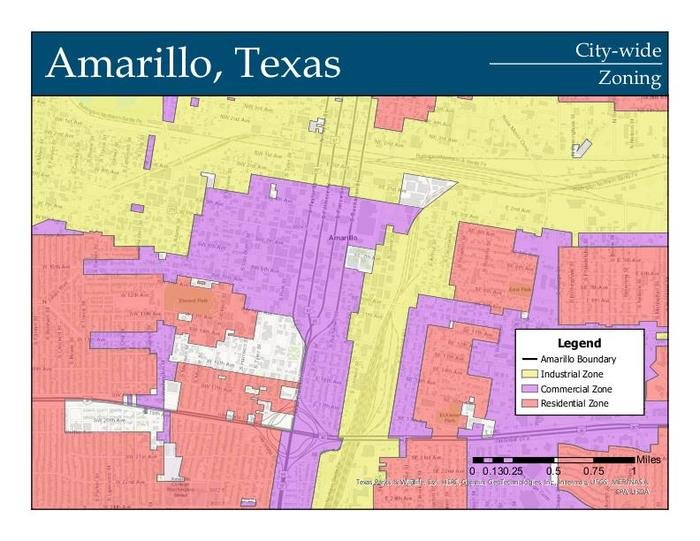
A city center view showing only zoning.
View PDF
View PDF
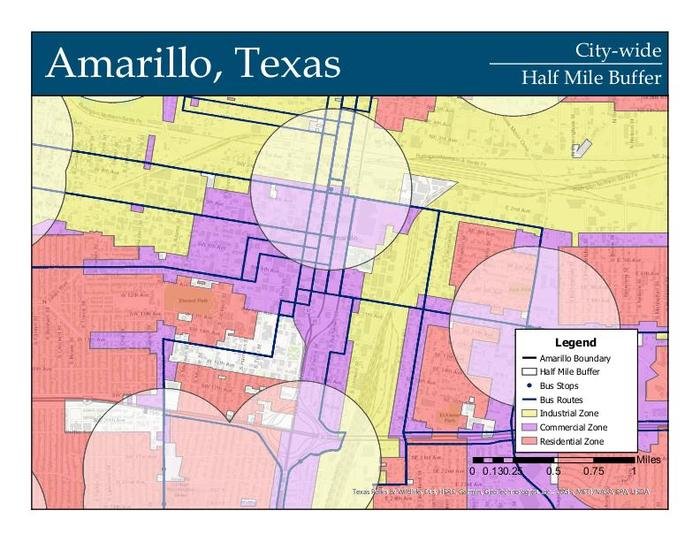
A city center view showing zoning, with public transit lines. Stops have a half mile buffer around them (longest distance considered walkable) to determine transit coverage.
View PDF
View PDF
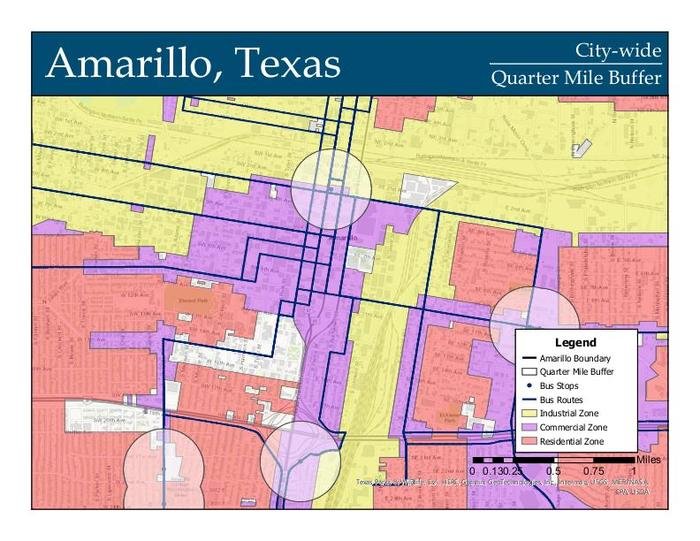
A city center view showing zoning, with public transit lines. Stops have a quarter mile buffer around them (average distance considered walkable) to determine transit coverage.
View PDF
View PDF

Improvement area map showing zoning, light rail and bus routes and stops, and the city boundary.
View PDF
View PDF

An improvement area view showing only zoning.
View PDF
View PDF

An improvement area view showing zoning, with public transit lines. Stops have a half mile buffer around them (longest distance considered walkable) to determine transit coverage.
View PDF
View PDF

An improvement area view showing zoning, with public transit lines. Stops have a quarter mile buffer around them (average distance considered walkable) to determine transit coverage.
View PDF
View PDF

Improvement area map showing potential new bus routes to increase coverage based on spatial analysis identifying areas in need of improvement. Salt Lake City was used as a comparative case to based the new routes off of.
View PDF
View PDF

Improvement area map showing potential new bus routes to increase coverage based on spatial analysis identifying areas in need of improvement. Half mile buffer to identify largest extent of new coverage. Salt Lake City was used as a comparative case to based the new routes off of.
View PDF
View PDF

Improvement area map showing potential new bus routes to increase coverage based on spatial analysis identifying areas in need of improvement. Quarter mile buffer to identify average extent of new coverage. Salt Lake City was used as a comparative case to based the new routes off of.
View PDF
View PDF
gLike
Geography 93 Course Project - Amarillo Transit Coverage and Proposal
One of two cities used for a comparative analysis of public transit coverage. Quarter mile and half mile buffers were used from light rail and bus stops to determine transit coverage range. Zoning was overlayed to identify specific zones outside transit coverage. SLC was used as an example of good transit coverage when compared to Amarillo, TX. Lessons taken from SLC were applied to potentially improve Amarillo's public transportation coverage.


